
Smart Impact shows one day of water heating through Cala's eyes: how much water and energy you used, what it cost, and how well Cala moved heating to cheaper or solar hours.
Open Smart Impact
-
In the Cala app, tap the menu icon at the top left, then tap INSIGHTS.
-
Tap SMART IMPACT. If your home has more than one Cala, pick the water heater you want to see.
-
The SMART IMPACT screen opens on yesterday. Tap the arrows beside the date to look at earlier days.
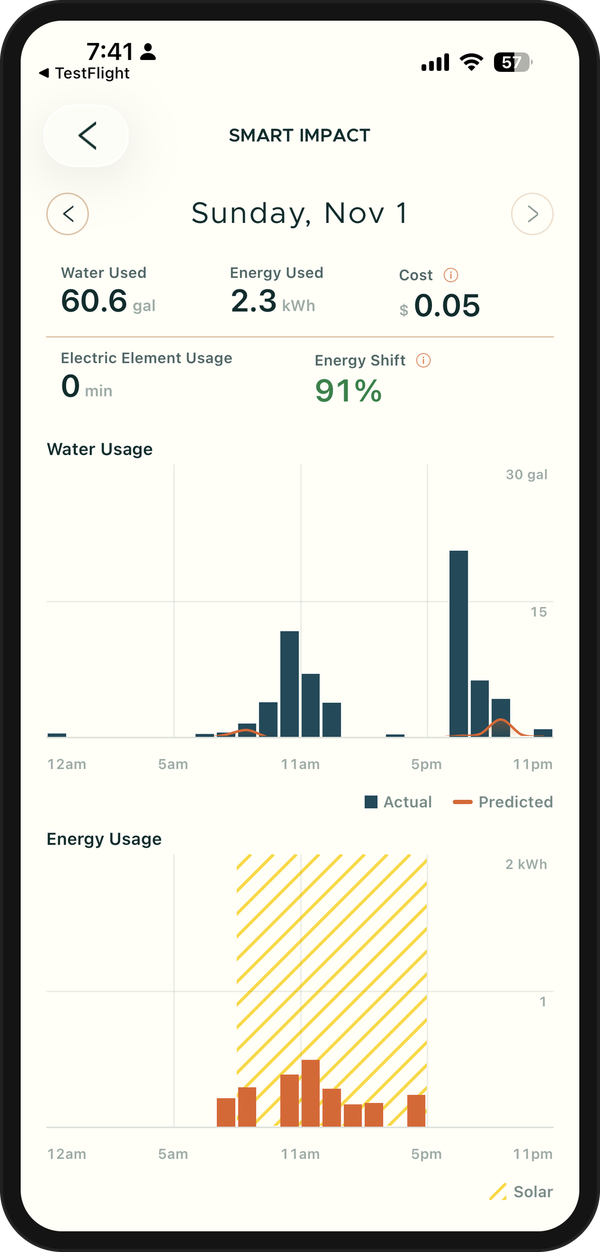
Smart Impact for one day: the tiles at the top, then the charts.
What the tiles mean
- Water Used: gallons of hot water used that day.
- Energy Used: kWh of electricity your Cala used that day.
- Cost: the energy used each hour multiplied by your price for that hour, added up for the day. Hours when your solar panels were producing count as free. This tile only shows if Cala has your time-of-use rates (see Add your time-of-use rates).
- Electric Element Usage: minutes the backup electric elements ran. The heat pump is the efficient way to heat; the elements help when demand is high.
- Energy Shift: the share of the day's energy Cala moved to low-cost or solar hours. Big, unexpected hot water use and Boost can force heating during peak hours, which lowers the score. It only applies on days with solar production or time-of-use rates.
Tap the info icon on a tile to read how it's worked out. On the Cost tile, tap SOLAR PREFERENCES to choose how Cala uses your solar (see Fine-tune how Cala heats: Advanced Settings).
Reading the charts
Water Usage
Bars show the hot water you actually used each hour (Actual). The line shows what Cala expected you to use (Predicted). The closer they match, the better Cala knows your routine.
Energy Usage
If you have time-of-use rates or solar panels, a second chart shows the electricity used each hour. The background shades from your cheapest price to your peak price, and marks the hours your solar panels were producing, so you can see Cala heating when energy was cheap.
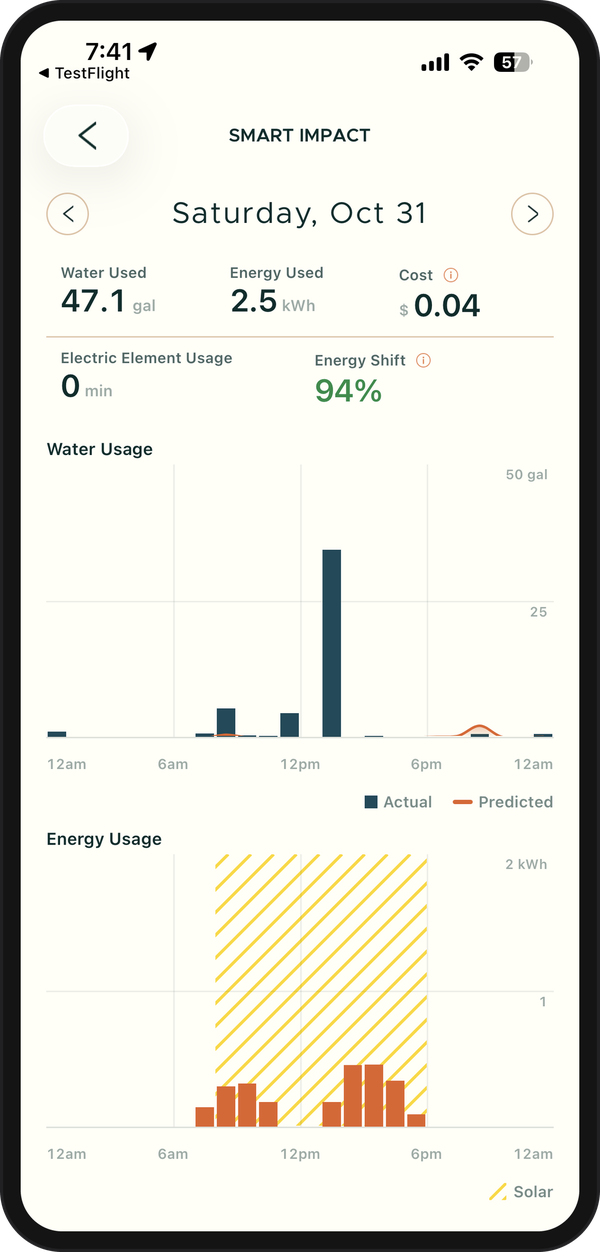
Press and drag across either chart to read the numbers for each hour.